Diffraction, or why a point source image isn't one
An interesting effect happens when waves hit an edge, it's called 'diffraction'. The result of this is that the waves actually bend around the edge.
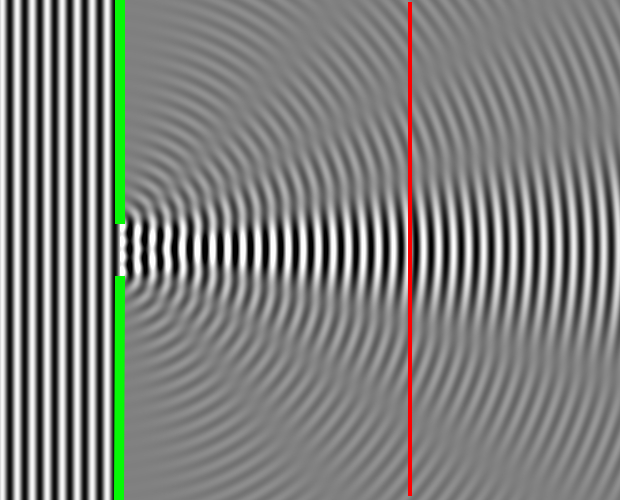
In the image to the right wavefronts (indicated by the white lines) travel from left to right where they hit upon the green wall, which has a small (compared to the wavelength) opening in it.
As is visible - and maybe contrary to intuition - the wavefronts do not travel undisturbed onwards to the right - rather, they become expanding circles just like when a stone is thrown in the water.
The most non-intuitive effect is that if a detector is put at the location of the
red line a pattern of light and dark will be detected in
stead of a uniformly lit patch where the image of the point source is expected.
![]()
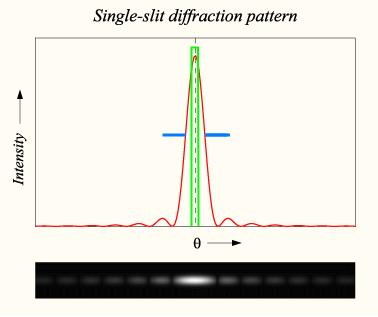
A graph of the intensity of the pattern along the red line will look like the figure to the left.
As is clearly visible it is not a sharp image of a point source at all. For comparison: the green line shows the intensity of the point source as function of its width; it is narrow and has an even brightness across its width.
At the detector light is detected "far" outside the extent of the original point source; the small peaks to the left and right of the central peak. In the lower part of the figure they are visible as the low intensity patches of light.
The width of the red peak at half its maximum value - indicated with blue - is a measure of how severely the imaging device, the slit in this case, blurs the image of the point source.
It is this width which defines the resolving power of the device: if two (point)sources are closer than the width of this peak, the device cannot tell them apart.
A model of wave propagation that explains diffraction is the Huygens-Fresnel principle.
From this simple model a very simple relation between the wavelength of the waves, the width of the slit (or lens, or mirror, for that matter), the distance to the detector and, most importantly, the width of the central peak can easily be derived.
With this model it can be predicted what the resolving power of a telescope will be before it is even built or, alternatively, it can be used to calculate how big a telescope is needed in order to reach a certain resolving power.
The rule of thumb following from this is that the resolving power of a telescope is directly proportional to λ/D with λ the observing wavelength and D the diameter of the telescope.
Read on what happens if an attempt is made to try to image a source through two slits rather than one.